Monroe NY Real Estate Results – Sept-Oct 2017
The Monroe, NY real estate results are available for October 2017. For those of you who actually take the time to read these market reports, you will notice I did not already write about September. I’m not sure how the entire month got away from me, but it did. Therefore, I will include both September and October in this report. Over the last few months, sales and revenues both remained strong.
Sales Volume
As mentioned previously, August 2017 had the highest number of sales in the past ten years with 33. While the last two months were not quite as strong, they still performed well. In September, there were 19 closed transactions and in October, 26. September 2017 was about even with the previous year, while October 2017 was 44% higher than the same month in 2016. The strong sales rate is evident with the inventory levels. At the beginning of September, inventory was in the upper 90s, and now it’s at 84. Homes are definitely selling!
Median Sales Prices
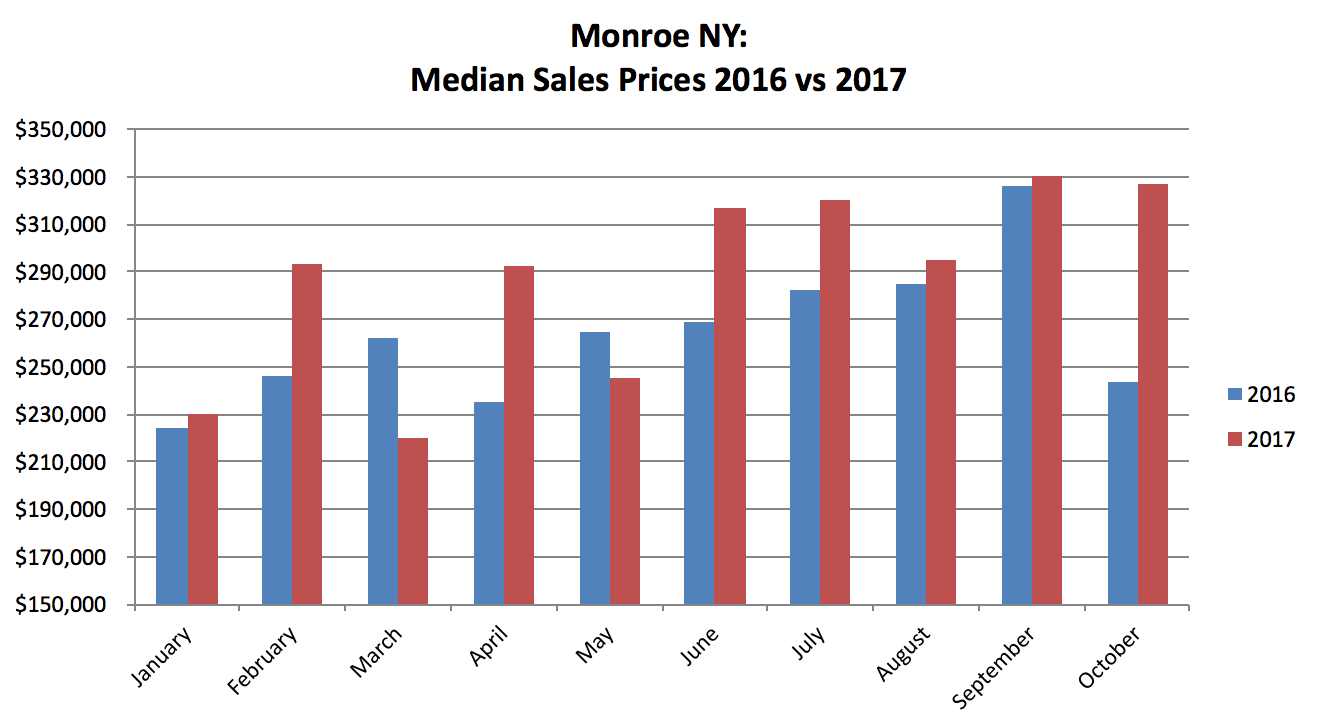
I don’t think there is a need to add much explanation to the chart below. Median sales prices have been hovering around $320-330K for four of the last five months, a much stronger result than in 2016.
Days on Market
Days on market have been decreasing as well. This measurement refers to the time it takes from listing a home to the date that home goes under contract. In April 2017, it was taking about four months to get from a new listing to a contract. In October, on average that time was two and a half months.
Bottom Line
The real estate market in the town of Monroe NY is healthy. Homes are selling, price points are strong, and days on market are shrinking. If you are a seller and want to put your home on the market, now is the time! To get started, call me on 914-419-0270 or email me at kat@thehousekat.com.

For previous market results reports, click here.